
After completing this unit, you’ll be able to:
- Understand the power of the UPN process mapping notation
- Learn the key aspects of the process map
- Capture maps in live workshops
- Understand the difference between UPN and flowcharts
PREREQUISITES
If you want to use Elements Catalyst for mapping processes you will need a free user account.
WHO NEEDS PROCESS MAPS
Once you understand the audience of the process maps then it becomes far easier to deliver them in a format that your audience can easily understand.
There are several audiences;
- SME (Subject matter Experts): working with them to help understand their requirements when building/enhancing solutions
- developers: they need to see the context for their user stories so they understand what to configure, code and test.
- end users: providing guidance and training to complete a task, supported by the solution.
- auditors: who want to understand the processes that should be followed to maintain regulatory compliance.
- senior execs: processes help define the key metrics that should be measured.
UNIVERSAL PROCESS NOTATION
Flowcharts and swimlanes were the way that most analysts and consultants used to capture requirements and business processes. But this has changed over the last 5–10 years and now there is a simpler and more engaging diagramming notation. It is proven in major highly regulated industries right down to innovative startups and small nonprofits. It is called UPN (Universal Process Notation) and it is not proprietary to any company.
There are several factors driving this change (think of it as an upgrade!!):
- The diagrams need to be developed and viewed online rather than printed out and pasted on conference room walls.
- They are often created in collaborative web-conferences rather than in-person meetings.
- They need to be understood by a range of stakeholders with different backgrounds and disciplines with a short attention span.
- They need to cope with both wide ranging (lead to cash) and narrow focused (edit opportunity) processes.
- They are the solution configuration documentation and can be used for impact analysis of future changes.
- They need to be used to support the different regulatory regimes so need version control and sign-off.
- They link to other existing supporting materials (guidance, notes, training, apps)
- They are a living document that exists beyond any specific project as they are the “operations manual” or DNA of the company.
Some subtle but critical aspects of UPN
- Activity boxes start with verbs; this makes the processes more accurate/specific. Avoid using ‘manage’
- Activity boxes have a ‘resource’ rather than positioned on a swimlane; this enables the diagrams to be tighter with a more logical flow left to right and activity boxes can have multiple resources.
- Lines with text exist between every activity box; these are the handoffs between processes and are absolutely fundamental as many process issues are misunderstanding on what the handoff criteria are e.g. what is the shared and agreed definition of “qualified lead” or “closed opportunity”.
- Decisions are several lines coming out of an activity box with line text explaining flow; this reduces the number of activity boxes on a diagram without losing any of the information
- Drill downs give more detail; this enables the diagrams to be kept to 8–10 boxes, but still describe a broad scope or complex processes. There is no limit to the number of levels you can go down (shown as corners).
- Attachments show documents/metadata/metrics in context; this reduces the time to find the related documentation (shown as paperclips).
MAPPING PROCESSES
Here is a short video below that will take you through the UPN mapping principles. (link http://bit.ly/processmapping) You will need to run a free user account.
Some key principles to take away from the video.
- Diagrams can be drawn in any format or style but this approach really works.
- Draw the diagrams in a simple left to right process flow aiming to have no more than 8-10 process steps per diagram, called activity boxes.
- The activity box is a single, simple building block to show what is done and by whom. It is all you need. You don’t need lots of different shapes. Trust us.
- You MUST have lines between boxes with text. These define the handoffs, which is where most processes break down. The more specific the better.
- Any activity box can have lower level “child diagrams”. This makes each diagram simple, with the detail in lower levels.
- Think about the 3 audiences when creating these diagrams: admin/developers, end users, compliance/auditors.
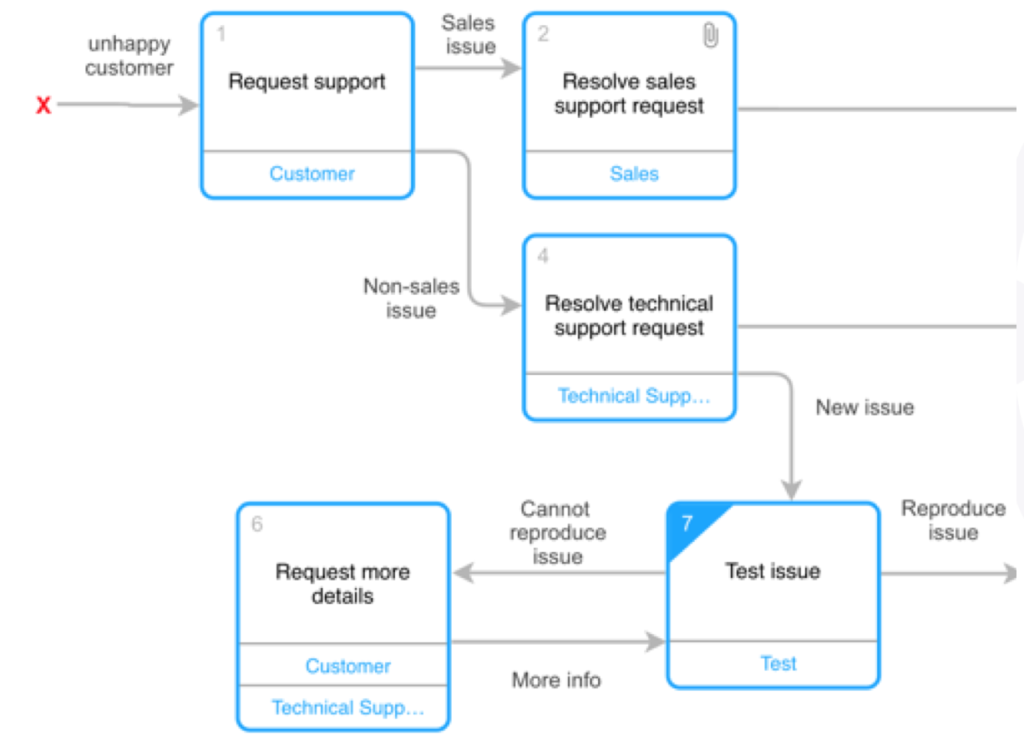
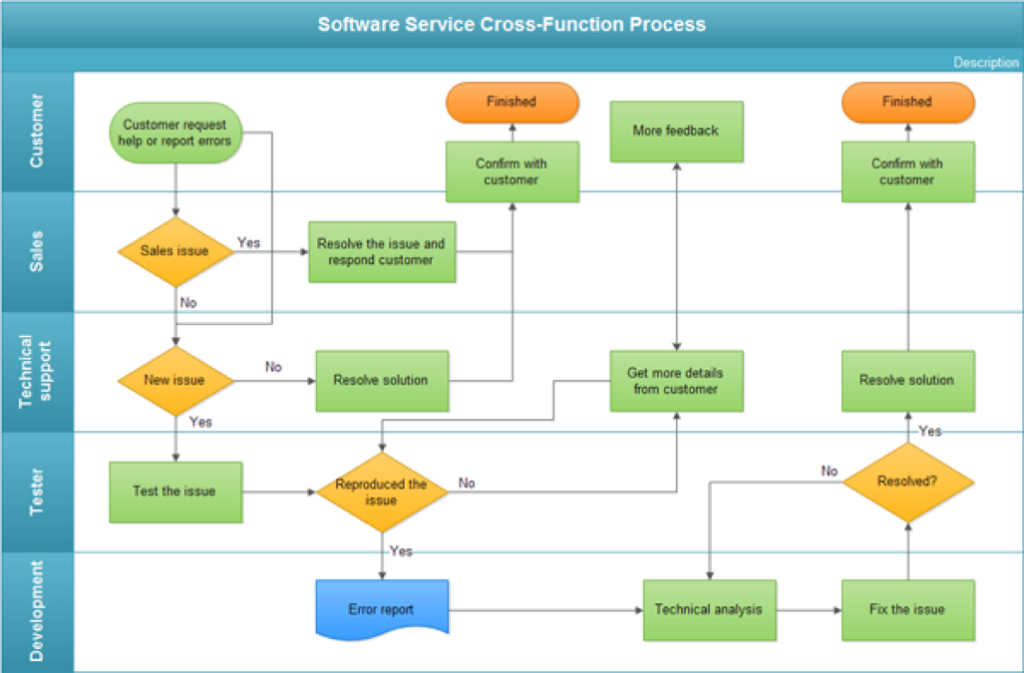
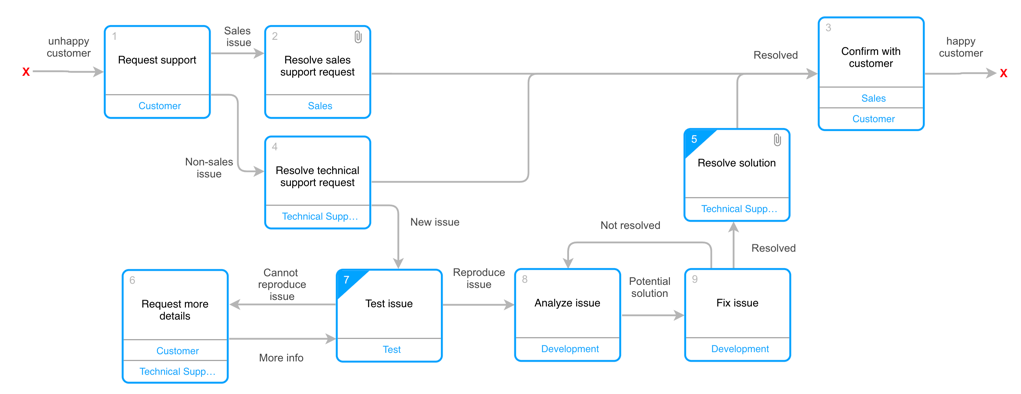
MAPPING vs FLOWCHARTS vs SWIMLANES
Many of you are used to flowcharts. Here is an example flowchart with swimlanes and below it is EXACTLY the same flow drawn in the UPN format. The UPN diagram has 50% of the boxes on screen but actually has more information, and it is easier to read as it flows left to right. If you don’t believe me, compare the 2 diagrams.
NEXT – Writing User Stories